Economic Indicators and Indonesia's GDP, FDI, and Trade Trends
Indonesia's economy continues to demonstrate resilience and growth amidst global economic challenges, maintaining its position as one of Southeast Asia's strongest economies. This update provides the latest economic indicators, investment trends, and policy developments that shape Indonesia's economic landscape in 2025.

Gross Domestic Product growth and forecast
Indonesia recorded an economic growth of 5.03 percent in 2024, showing a slight slowdown from the 5.05 percent growth achieved in 2023. Despite this minor deceleration, Indonesia's growth remains impressive compared to many G20 economies, reflecting the country's economic resilience.
Looking ahead, the Indonesian government has adjusted its economic growth projection for 2025 to a range of 5.1 to 5.5 percent, as announced by Finance Minister Sri Mulyani Indrawati in a parliamentary session. This represents a slight downward revision from the earlier projection of 5.3 to 5.6 percent that was initially outlined by the Minister of National Development Planning.
The economic agenda for 2025 has been established with a clear theme: "the acceleration of inclusive and sustainable economic growth". This theme carries particular significance as 2025 marks the beginning of Indonesia's 2025-2029 National Medium Term Development Plan (RPJMN), which serves as a crucial component of the longer-term 2025-2045 national development strategy aimed at achieving "golden Indonesia".
Foreign Direct Investment trends
In the first quarter of 2025, FDI (excluding investment in banking and oil & gas sectors) grew by 12.7 percent year-on-year to IDR 230.4 trillion (US$13.67 billion). This represents a notable deceleration from the robust 33.3 percent growth recorded in the fourth quarter of 2024, marking the weakest FDI growth since the final quarter of 2023.
The investment landscape for 2024 was particularly strong, with total direct investment, including domestic sources, reaching IDR 1,714.2 trillion (approximately US$105.13 billion), representing a 20.8 percent increase compared to the previous year. This substantial growth demonstrates Indonesia's continued attractiveness as an investment destination.
The sectoral distribution of foreign investment shows particular strength in basic metal industries, transportation, and mining. Indonesia's strategic policy decision to ban nickel ore exports in 2020 has yielded positive results, attracting significant foreign investment in mining and metal smelting industries, particularly from investors interested in the electric vehicle supply chain.
Singapore maintains its position as the largest source of FDI into Indonesia, contributing US$4.6 billion in the first quarter of 2025, followed by Hong Kong (US$2.2 billion) and China (US$1.8 billion). This reflects the ongoing importance of regional economic integration and Indonesia's strategic position within Asian investment networks.
The investment growth has generated substantial employment opportunities, with total direct investment (including domestic sources) in the first quarter of 2025 creating more than 594,100 jobs nationwide. This job creation is critical for Indonesia's efforts to reduce unemployment rates, which the government aims to maintain between 4 and 5 percent in 2025.
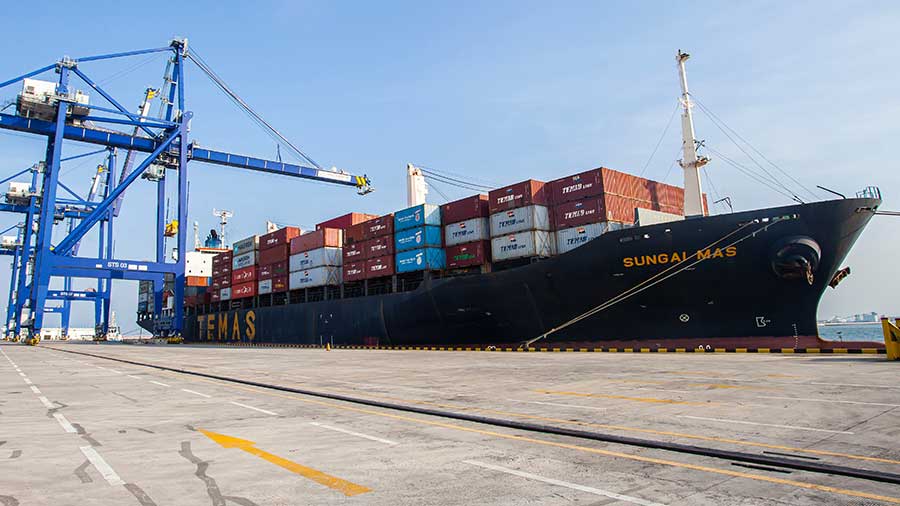
Indonesia’s import and export statistics
Export performance in early 2025
Indonesia’s exports showed a positive trajectory in the first quarter of 2025, with total export values reaching approximately US$66.62 billion from January to March. This represents a 6.93 percent increase year-on-year, underscoring steady demand for Indonesian goods internationally.
-
January 2025: Exports stood at US$21.45 billion, marking a 4.68 percent increase compared to January 2024, though slightly below market expectations.
-
February 2025: Exports surged to US$21.98 billion, growing by 14.05 percent year-on-year, the highest monthly export value since January 2023.
-
March 2025: Exports further increased to US$23.25 billion, a 5.95 percent rise from the previous month and a 3.16 percent increase year-on-year.
Key export commodities
-
Metal ores, slag, and ash: Notably, this category experienced explosive growth, with exports in March 2025 soaring by over 4,100 percent to US$573.6 million.
-
Iron and steel products
-
Machinery and electrical equipment
-
Oil and gas products: Oil product exports rose by 28.81 percent in March 2025 compared to the previous year.
Main export destinations
Indonesia’s exports are primarily directed to major global markets, including:
-
United States: 11.6 percent of total export volume
-
China: 10 percent
-
Japan: 9.9 percent
-
India: 8.8 percent
-
Singapore: 7 percent
Import trends in early 2025
Imports into Indonesia also demonstrated robust activity in early 2025, essential for supporting domestic consumption and industrial production.
-
January 2025: Imports were valued at US$18.00 billion.
-
February 2025: Import values increased to US$19.35 billion, a 10.5 percent rise year-on-year.
-
March 2025: Imports reached US$20.10 billion, marking a 3.9 percent increase month-on-month and a 7.2 percent increase year-on-year.
Major import categories
-
Machinery and mechanical appliances
-
Electrical equipment and components
-
Mineral fuels and oils
-
Chemicals and related products
-
Food and beverages
| Indonesia Economic Profile (1990-2020) | ||||
| 1990 | 2000 | 2010 | 2020 | |
| World view | ||||
| Population, total (millions) | 181.41 | 211.51 | 241.83 | 273.52 |
| Population growth (annual %) | 1.8 | 1.4 | 1.3 | 1.1 |
| Surface area (sq. km) (thousands) | 1,910.90 | 1,910.90 | 1,910.90 | 1,916.90 |
| Population density (people per sq. km of land area) | 100.1 | 116.8 | 133.5 | 145.7 |
| Poverty headcount ratio at national poverty lines (% of population) | .. | 19.1 | 13.3 | 9.4 |
| Poverty headcount ratio at $1.90 a day (2011 PPP) (% of population) | 54.9 | 34.9 | 13.3 | 2.7 |
| GNI, Atlas method (current US$) (billions) | 101.91 | 122.45 | 612.25 | 1,059.51 |
| GNI per capita, Atlas method (current US$) | 560 | 580 | 2,530 | 3,870 |
| GNI, PPP (current international $) (billions) | 531.64 | 936.87 | 2,002.21 | 3,232.42 |
| GNI per capita, PPP (current international $) | 2,930 | 4,430 | 8,280 | 11,940 |
| People | ||||
| Income share held by lowest 20% | 9 | 9.6 | 7.6 | 6.9 |
| Life expectancy at birth, total (years) | 62 | 66 | 69 | 72 |
| Fertility rate, total (births per woman) | 3.1 | 2.5 | 2.5 | 2.3 |
| Adolescent fertility rate (births per 1,000 women ages 15-19) | 67 | 50 | 51 | 46 |
| Contraceptive prevalence, any methods (% of women ages 15-49) | 50 | 55 | 61 | 56 |
| Births attended by skilled health staff (% of total) | 41 | 67 | 82 | 95 |
| Mortality rate, under-5 (per 1,000 live births) | 84 | 52 | 34 | 24 |
| Prevalence of underweight, weight for age (% of children under 5) | 31 | 24.8 | 18.6 | 17.7 |
| Immunization, measles (% of children ages 12-23 months) | 58 | 76 | 78 | 88 |
| Primary completion rate, total (% of relevant age group) | 93 | 94 | 101 | 102 |
| School enrollment, primary (% gross) | 114.3 | 108.8 | 109.2 | 106.4 |
| School enrollment, secondary (% gross) | 47 | 55 | 76 | 89 |
| School enrollment, primary and secondary (gross), gender parity index (GPI) | 1 | 1 | 1 | 1 |
| Prevalence of HIV, total (% of population ages 15-49) | 0.1 | 0.1 | 0.3 | 0.4 |
| Environment | ||||
| Forest area (sq. km) (thousands) | 1,185.50 | 1,012.80 | 996.6 | 921.3 |
| Terrestrial and marine protected areas (% of total territorial area) | .. | .. | .. | 5.3 |
| Annual freshwater withdrawals, total (% of internal resources) | 4.1 | 6.3 | 9.7 | 11 |
| Urban population growth (annual %) | 4.9 | 4.3 | 2.9 | 2.2 |
| Energy use (kg of oil equivalent per capita) | 544 | 736 | 877 | .. |
| CO2 emissions (metric tons per capita) | 0.82 | 1.32 | 1.72 | 2.18 |
| Electric power consumption (kWh per capita) | 163 | 390 | 636 | 1,084 |
| Economy | ||||
| GDP (current US$) (billions) | 106.14 | 165.02 | 755.09 | 1,058.42 |
| GDP growth (annual %) | 7.2 | 4.9 | 6.2 | -2.1 |
| Inflation, GDP deflator (annual %) | 9.1 | 20.4 | 15.3 | -0.5 |
| Agriculture, forestry, and fishing, value added (% of GDP) | 22 | 16 | 14 | 14 |
| Industry (including construction), value added (% of GDP) | 39 | 42 | 43 | 38 |
| Exports of goods and services (% of GDP) | 27 | 41 | 24 | 17 |
| Imports of goods and services (% of GDP) | 26 | 30 | 22 | 16 |
| Gross capital formation (% of GDP) | 33 | 22 | 33 | 32 |
| Revenue, excluding grants (% of GDP) | 20.2 | 18.7 | 14.5 | 12.3 |
| Net lending (+) / net borrowing (-) (% of GDP) | 0.4 | -0.3 | -0.7 | -2.2 |
| States and markets | ||||
| Time required to start a business (days) | .. | .. | 77 | 13 |
| Domestic credit provided by financial sector (% of GDP) | .. | .. | 34.2 | 53.7 |
| Tax revenue (% of GDP) | 19.1 | 11.6 | 10.5 | 9.8 |
| Military expenditure (% of GDP) | 1.4 | 0.7 | 0.6 | 0.9 |
| Mobile cellular subscriptions (per 100 people) | 0 | 1.7 | 87.4 | 130.1 |
| Individuals using the Internet (% of population) | 0 | 0.9 | 10.9 | 53.7 |
| High-technology exports (% of manufactured exports) | .. | .. | 12 | 8 |
| Statistical Capacity Score (Overall Average) (scale 0 - 100) | .. | .. | 87 | 86 |
| Global links | ||||
| Merchandise trade (% of GDP) | 45 | 66 | 39 | 29 |
| Net barter terms of trade index (2000 = 100) | 95 | 100 | 127 | 118 |
| External debt stocks, total (DOD, current US$) (millions) | 69,849 | 144,049 | 198,278 | 417,532 |
| Total debt service (% of exports of goods, services and primary income) | 33.5 | 22.8 | 18.7 | 36.7 |
| Net migration (thousands) | -35 | -1,150 | -454 | -495 |
| Personal remittances, received (current US$) (millions) | 166 | 1,190 | 6,916 | 9,651 |
| Foreign direct investment, net inflows (BoP, current US$) (millions) | 1,093 | -4,550 | 15,292 | 24,994 |
| Net official development assistance received (current US$) (millions) | 1,592.60 | 1,645.40 | 1,323.80 | -630 |