A New Perspective: How do ASEAN Economies Stand Against China’s Regions?
The staggering numbers of China’s GDP have often been compared with other countries. Statements such as the three Californias of China (Guangdong, Shandong, and Zhejiang) or how Shanghai’s GDP equals the one of Finland has surprised many.
Breaking down the US$13.6 trillion nominal GDP, looking behind the 6.6% GDP growth. and understanding the US$18,381 GDP per capita (PPP) can all be done by looking at each of China’s provinces.
As the China investor is facing testy times amidst the US-China Trade War, slowing growth, and other disruptions, he might consider becoming an Asia investor. The option of ASEAN as a ‘China plus one’ destination is oftentimes the most likely option.
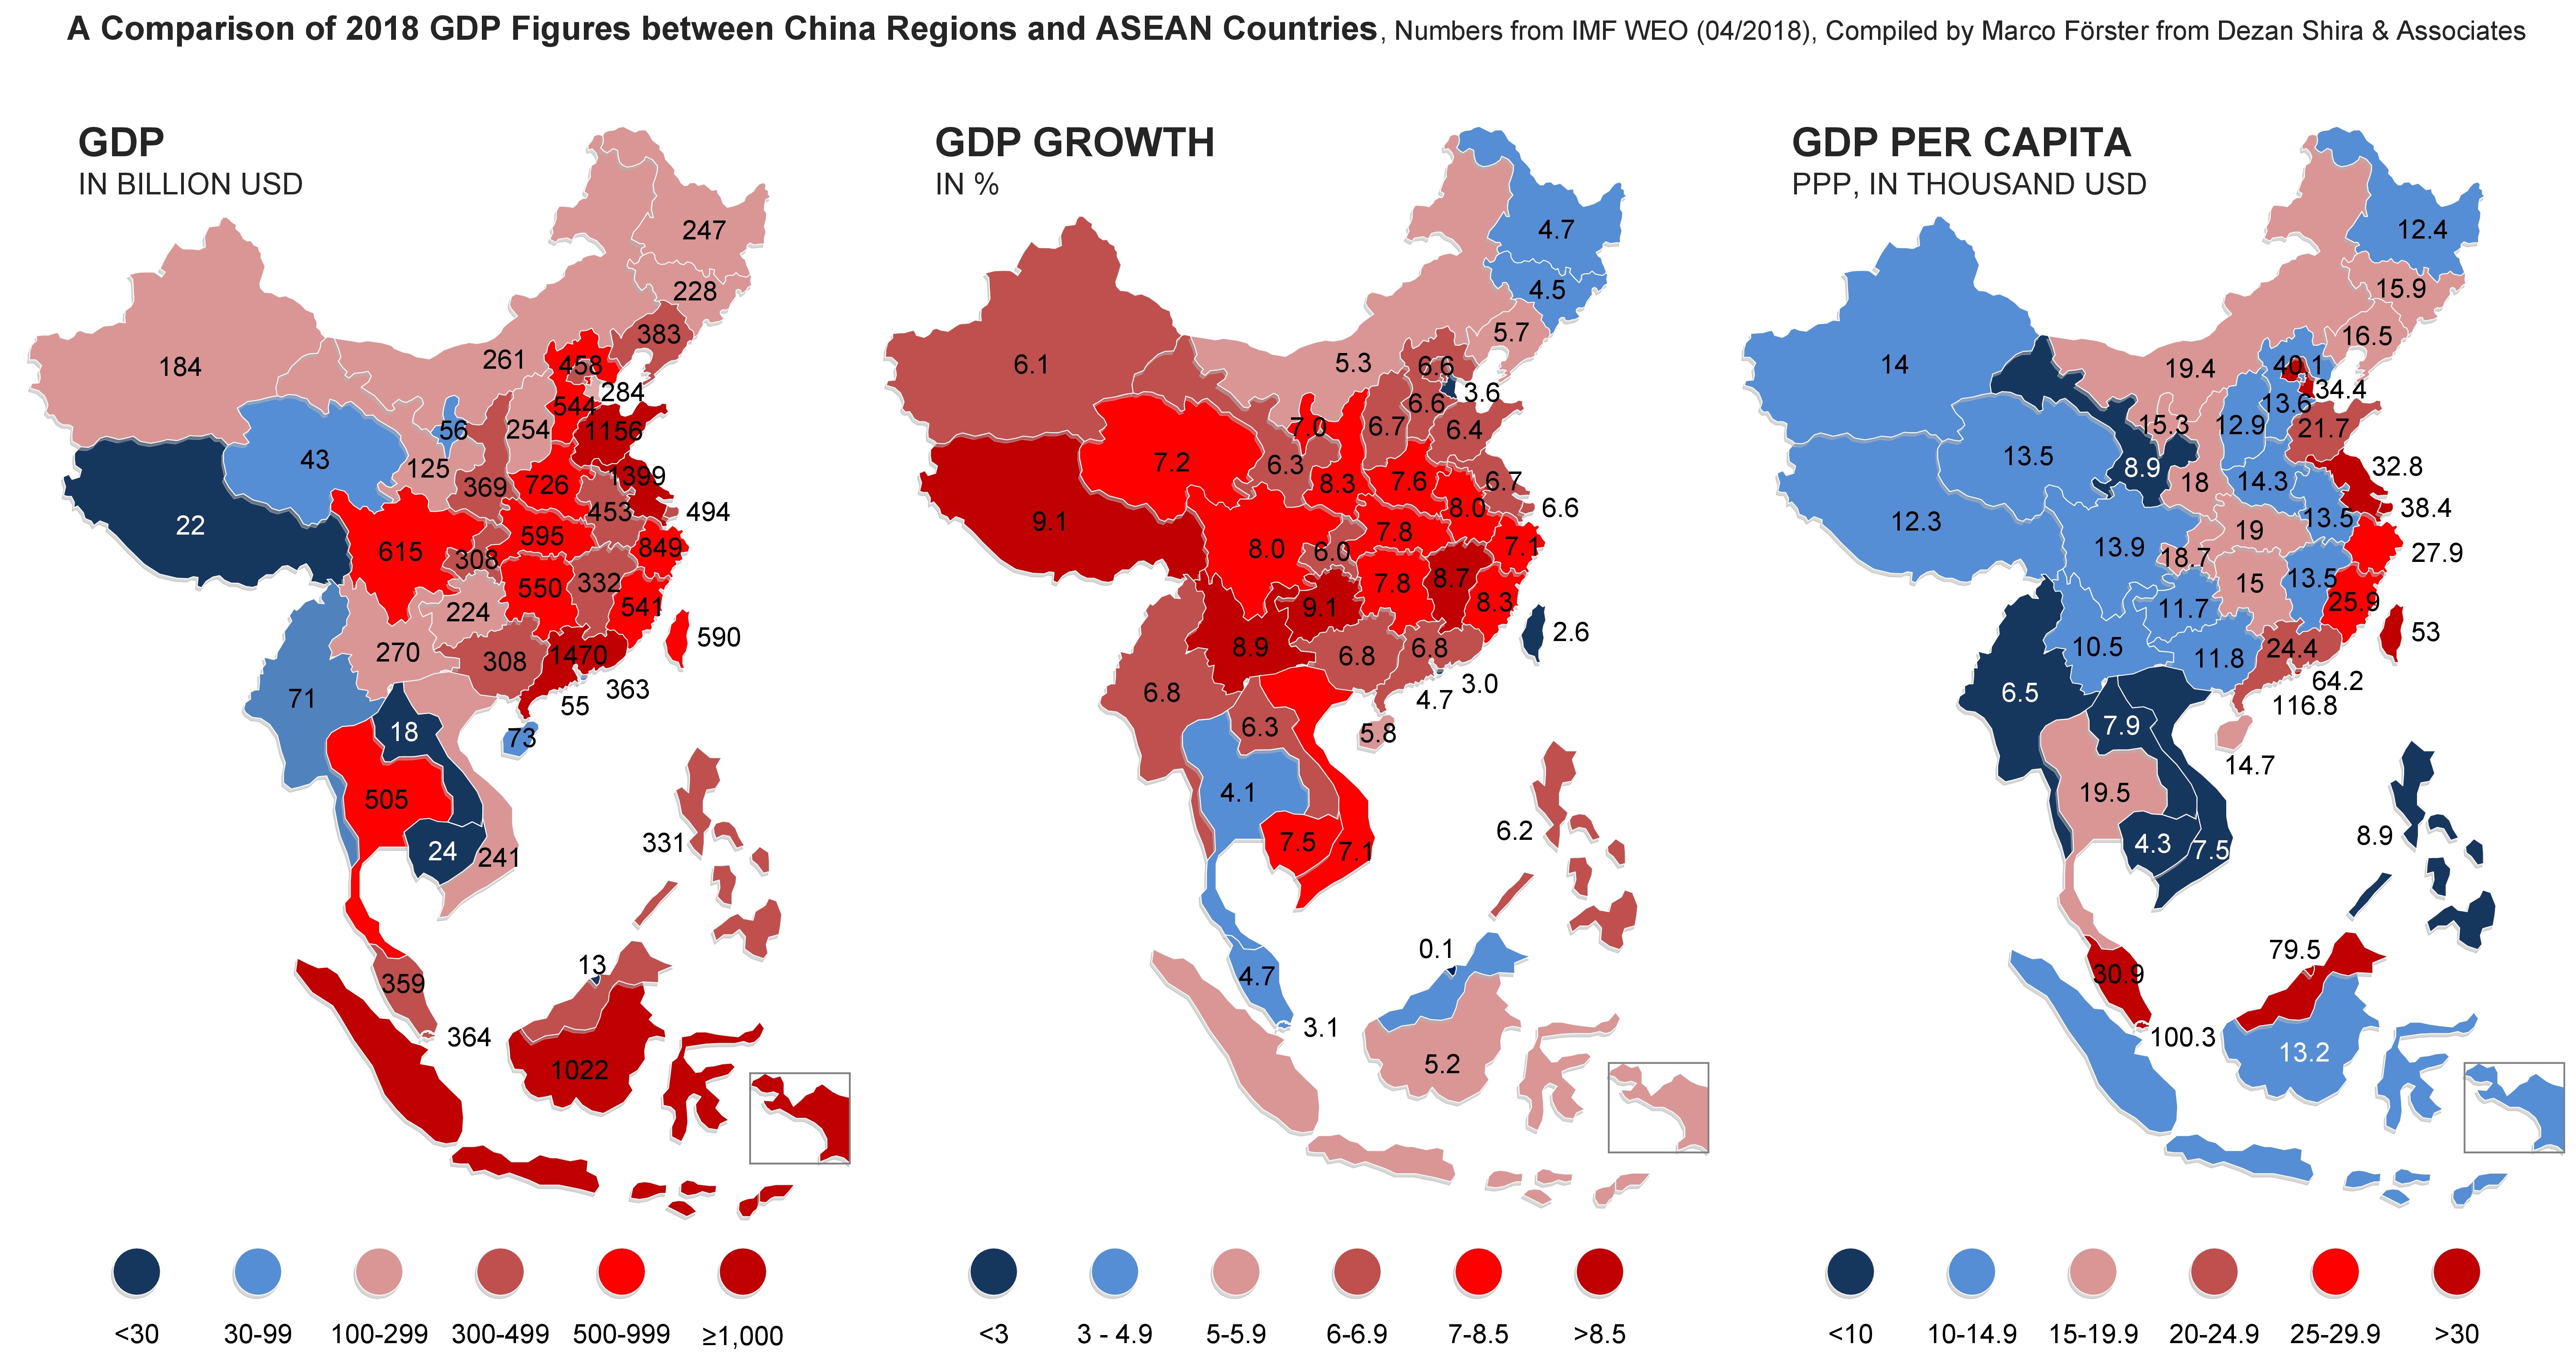
These three maps depict a more ‘level comparing field’ between ASEAN states and China regions. The three categories are 2018 figures for total GDP, GDP growth and GDP per capita. When positioning them next to each other, there is a lot that can be interpreted in them. And it might provide the investor with a few hints on pressing questions like where to move production to, which consumer markets to tap and where to look next.
With these three maps, China’s economic clout is being put back into perspective. China’s eastern provinces of Zhejiang and Fujian do incredibly well, being the only regions with a strong GDP, above-average GDP growth and high GDP per capita.Jiangsu has a higher GDP per capita than Malaysia and is definitely a good market for consumer products. Guizhou is smaller than Vietnam and both have a very similar GDP but Guizhou still beats Vietnam by 2 percentage points in growth.
Tibet’s aggressive poverty alleviation measures and infrastructure investments can be seen when comparing the GDP and growth maps. Northeast China features China’s slowest growth, which can be compared to the growth of Thailand and Malaysia. Gansu, China’s worst-performing province in terms of GDP per capita, is on par with the Philippines and beats Vietnam, Laos, Myanmar, and Cambodia.
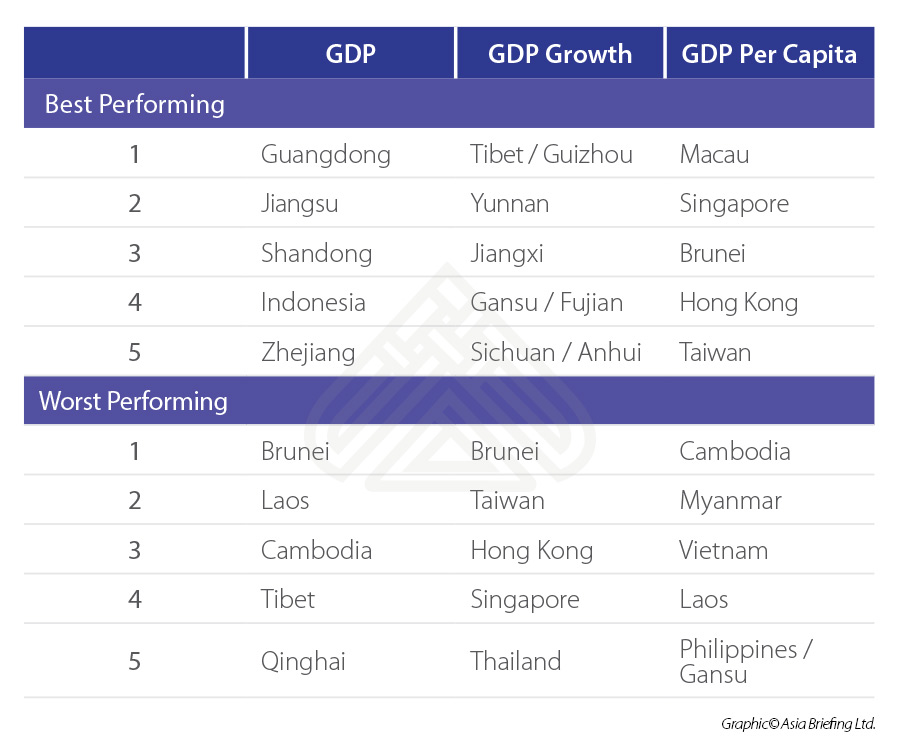
The best and worst-performing regions in each of these categories were:
These three economic indicators, however, provides only a basic overview of market performance. Similar charts showing debt growth, costs, productivity, and export processing zone locations or investment incentives, would provide a more all-round overview.
As new data for 2019 is likely to be released in the IMF’s World Economic Outlook in early Q2 next year, we will doubtlessly see a cooler China and a hotter ASEAN.
About Us
ASEAN Briefing is produced by Dezan Shira & Associates. The firm assists foreign investors throughout Asia and maintains offices throughout ASEAN, including in Singapore, Hanoi, Ho Chi Minh City and Jakarta. Please contact us at asia@dezshira.com or visit our website at www.dezshira.com.